Data visualization software as a business intelligence tool using visual elements to illustrate data and makes it easily perceived by the audiences. It combined pie charts, scatter plots and bar graphs to simplify the procedure to interpret the complex numbers. The article is going to analyze five of the top-rated data visualization software which is measured by sentiment scores. (Sentiment analysis is the interpretation and classification of emotions (positive, negative and neutral) within text data using text analysis techniques.)
Top 5 data visualization tools for reporting
| Product | Reporting sentiment score (out of 10) |
| Cognos | 6.71 |
| Google Data Studio | 6.30 |
| Tableau | 6.26 |
| Microsoft Power BI | 6.23 |
| Zoho Analytics | 6.15 |
1. Cognos
As an integrative intelligent business software capable of data analytics, scoreboard creation, visualization and reporting features. At the same time, the availability of report customization is the most attractive function of Cognos. In detail, it enables the users to add filters, metrics and custom colours to the report. Moreover, the tool powered by the AI which could automate the data preparation and the report generation.
Cognos’ data reporting sentiment score analysis
An overwhelming 74% of reviews that mention “reporting” are positive, and only 2% reflect negative sentiment.
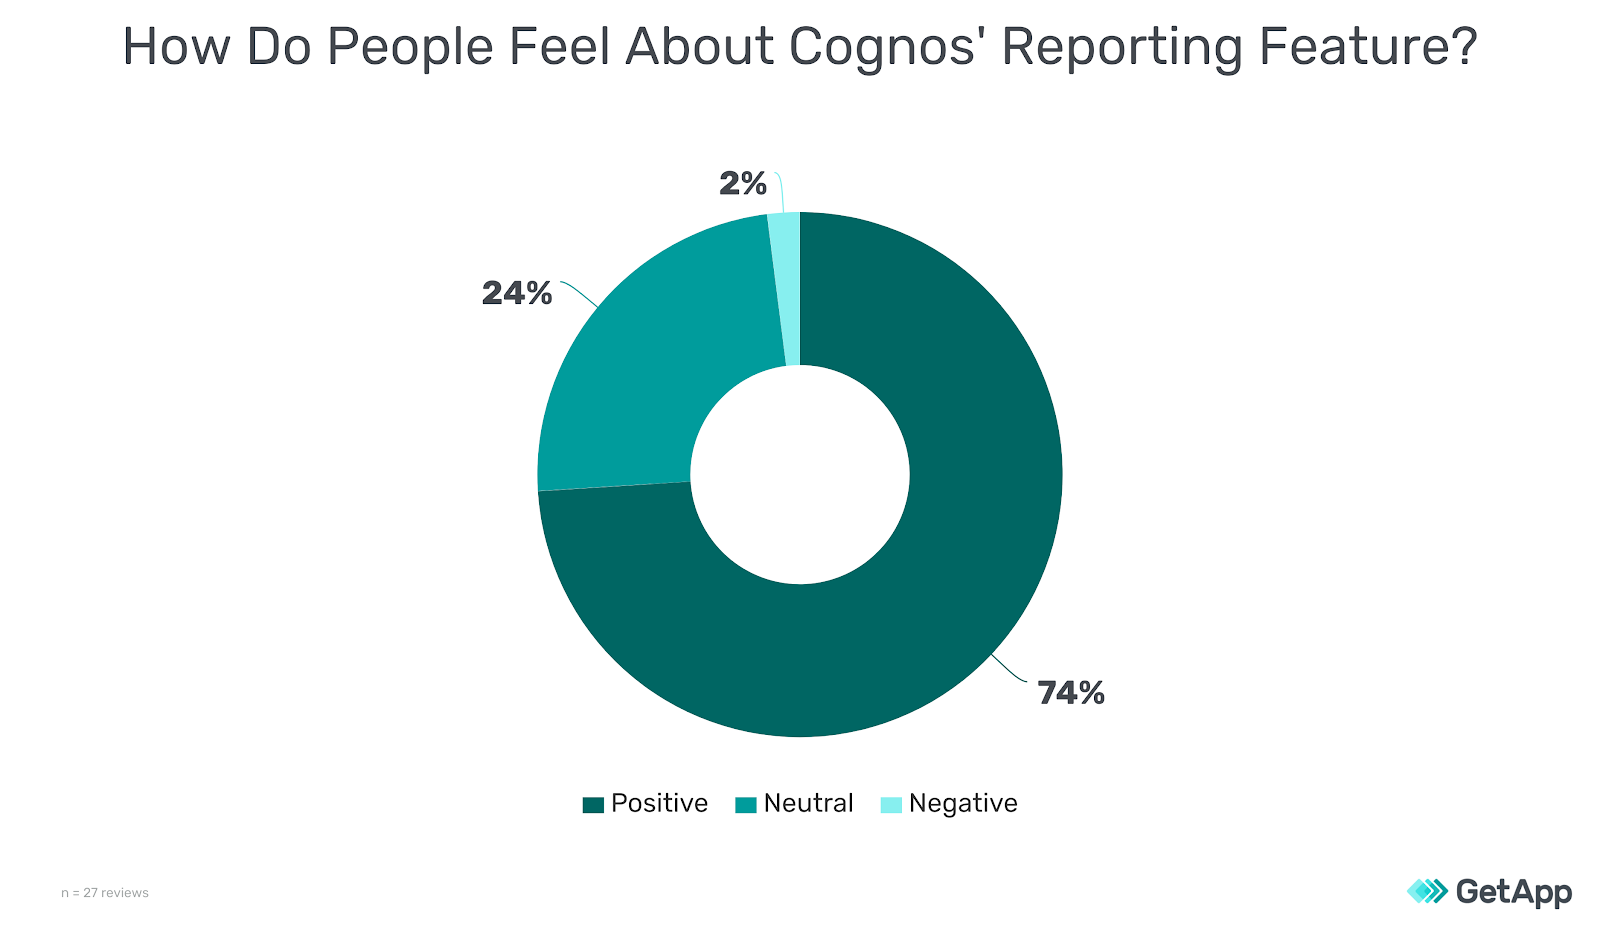
Cognos has a higher sentiment score for reporting than other products. It scores 6.71 against a category average of 6.13 (out of 10).

2. Google Data Studio
Interactive dashboard creation and reports are the features of Google Data Studio. It ascribes to the tool’s compatibility of the third-party source of data which includes Google Analytics and spreadsheets for identifying insights and patterns, then converted to reports.
Google Data Studio’s data reporting sentiment score analysis
None of Google Data Studio’s user reviews that mention “reporting” express negative sentiment. 67% of reviews are positive, while the remaining are neutral.
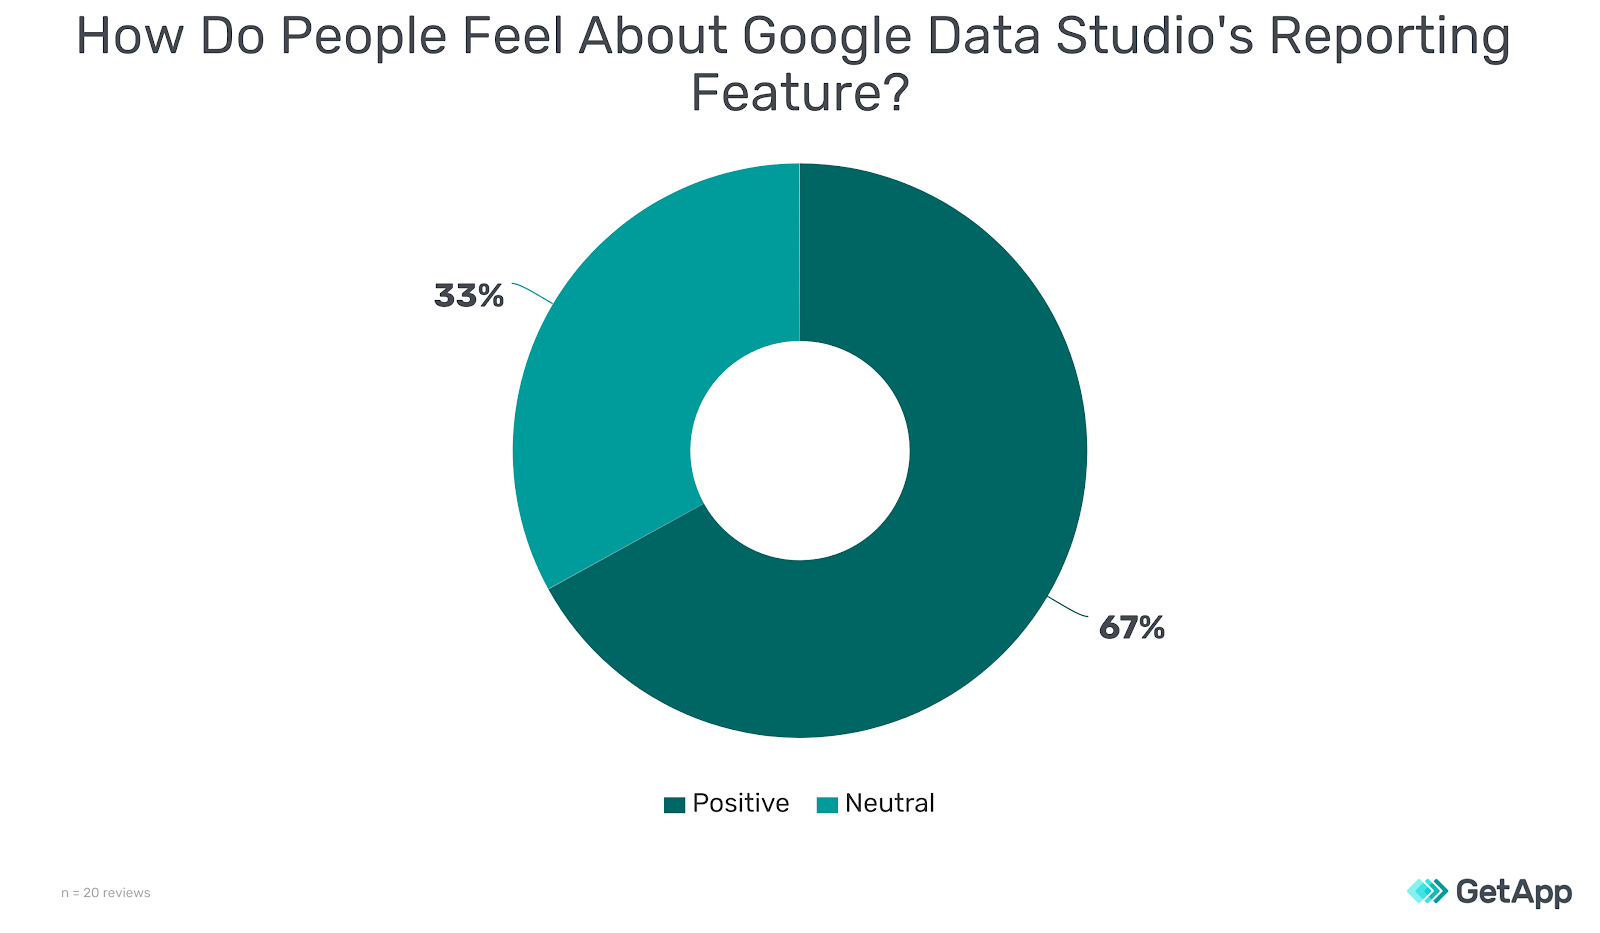
Google Data Studio has a higher sentiment score (6.30) for reporting than the average sentiment score for the data visualization software category (6.14).
3. Tableau
As a data analysis tool that supports data preparation, visualization and reporting, Tableau capable of the ability to integrate multi-resources data. From CSV files to Google Analytics data and Salesforce data. At the same time, export options include most of the chart formats in the industry as well as the colour-coded map which drag-and-drop function is friendly to the unskilled users.
Tableau’s data reporting sentiment score analysis
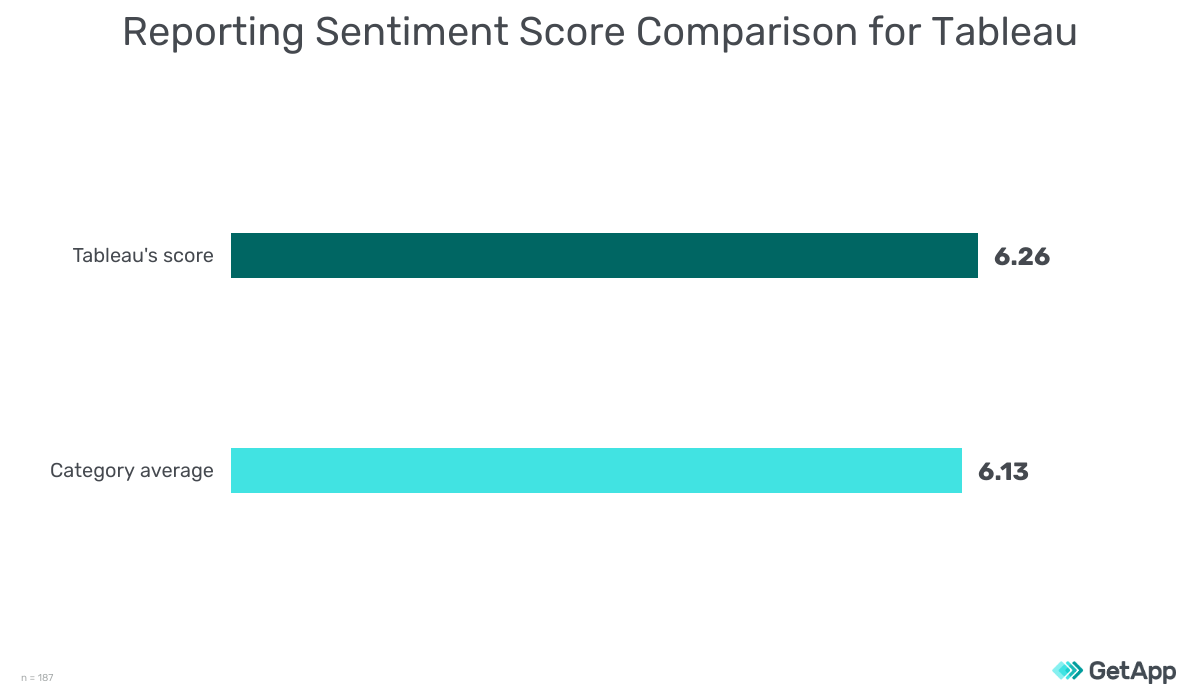
Of all the user reviews mentioning Tableau’s reporting capabilities, 66% are positive and 30% are neutral.
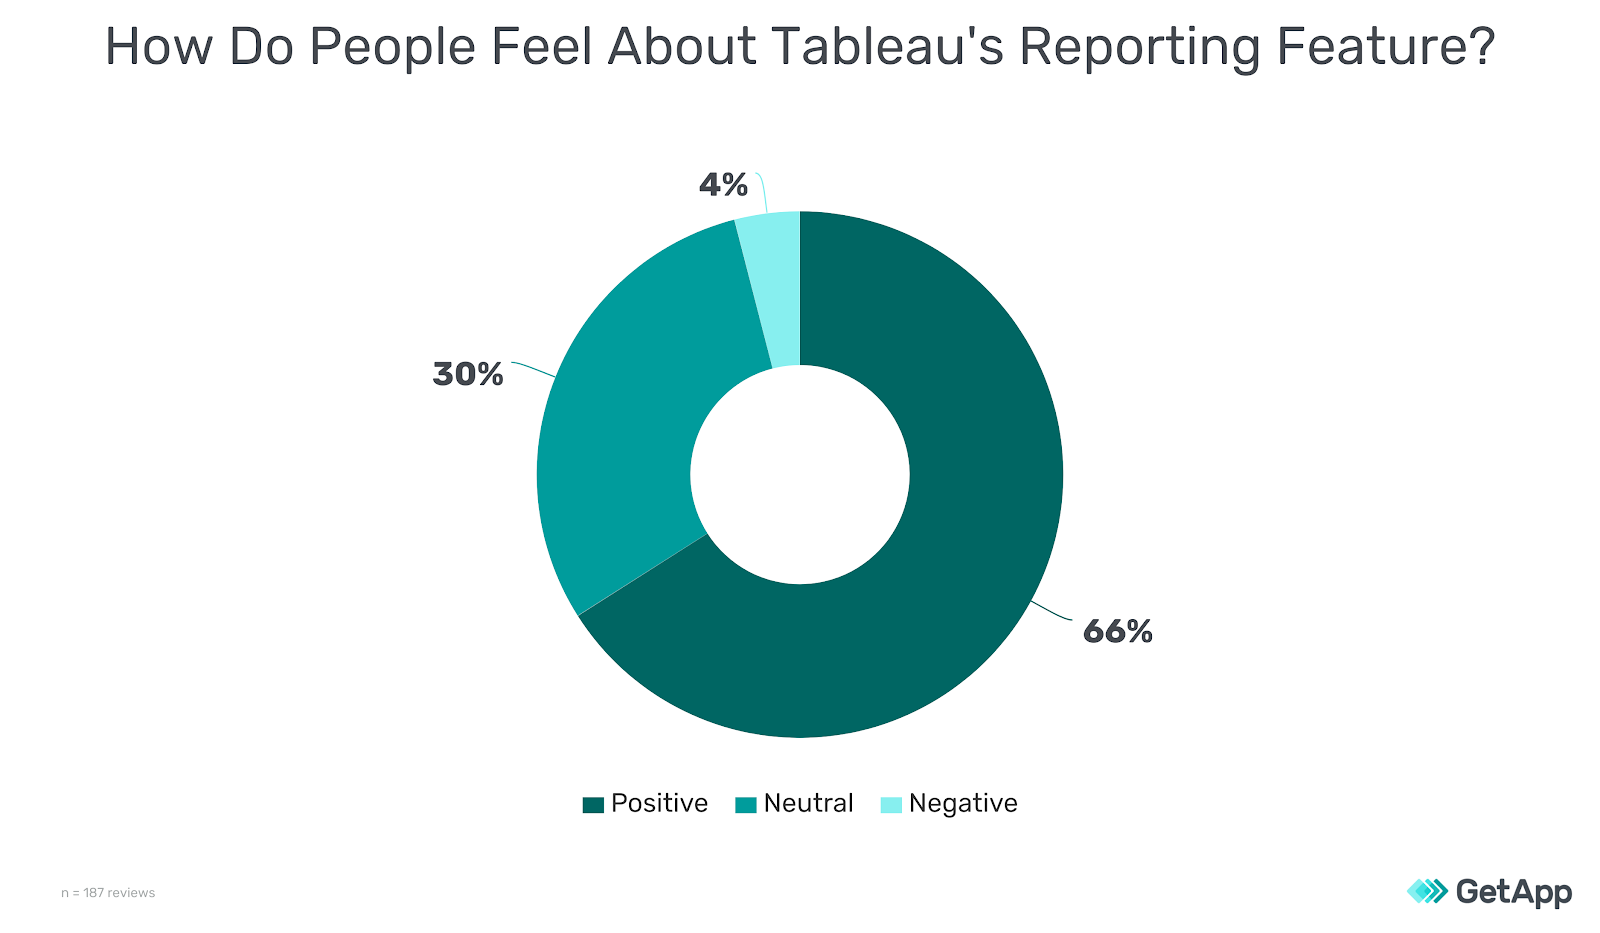
Tableau scores 6.26 in user sentiment for its reporting feature against an average sentiment score of 6.13 for the data visualization software category.
4. Microsoft Power BI
Microsoft Power BI strengthens at its visual elements such as area charts, gauge meters, maps and key influencer charts and cards, moreover, it does offer an open-source data visualization library for users to customize visual reports. In addition, Microsoft Power BI can help users to connect different data sets, transform and organize it into the model and charts which largely reduce the effort that users invest in data analyzing.
Microsoft Power BI’s data reporting sentiment score analysis
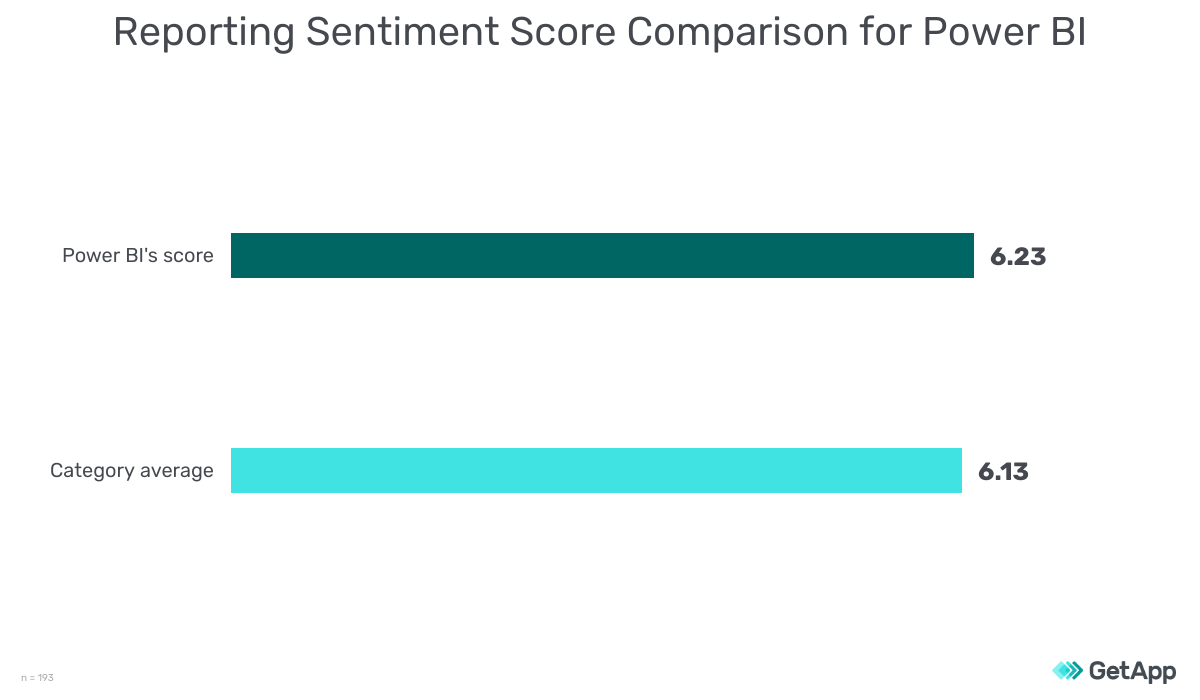
66% of Power BI’s user reviews mentioning “reporting” have positive sentiment, and only 3% are on the unhappy side.

Power BI has a higher sentiment score (6.23) than the average score (6.13) for all other products in the data visualization software category.
5. Zoho Analytics
Zoho Analytics is a self-service Business Intelligent & Analytics Software that is a user-friendly tool by its automated reports and AI features. It allows the user to generate various types of graphic representation, charts, reports and work seamlessly with most of the databases. The scheduled email highlighted the product after setting up a tailor-made report for the customer, Zoho Analytics automatically sends an email to the customer with an up-to-date copy of reports.
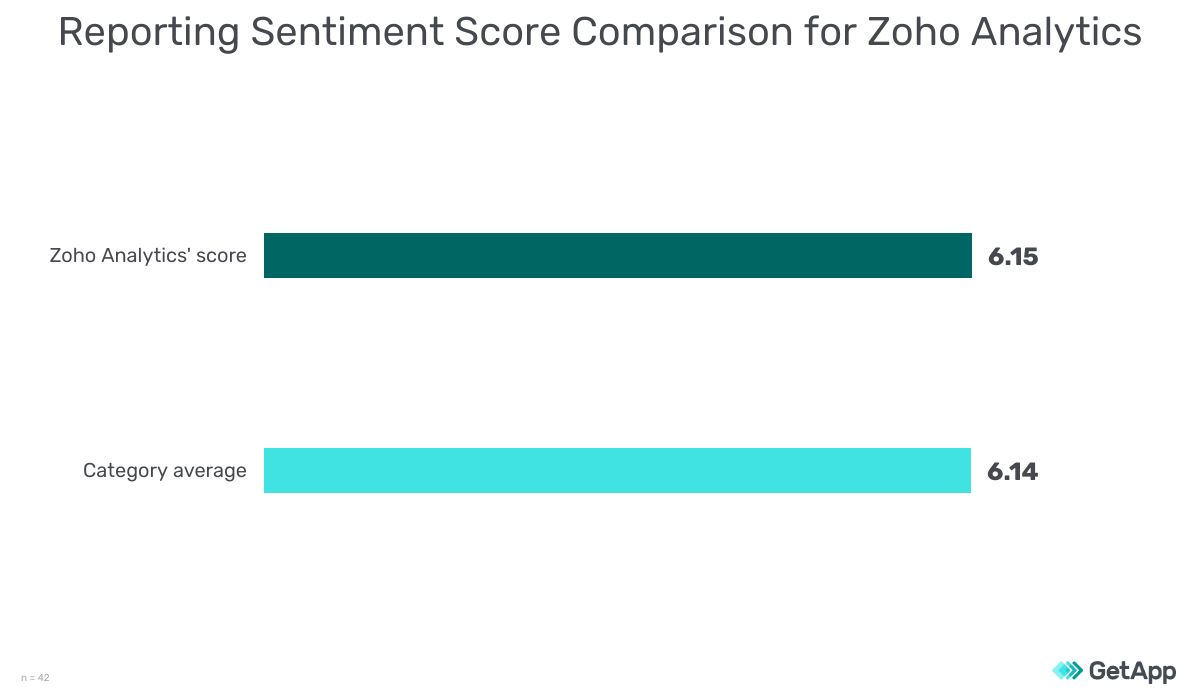
Zoho Analytics’ data reporting sentiment score analysis
Overall, most reviewers have a positive or neutral view of Zoho Analytics’ reporting capabilities. 68% of the reviews are positive, while 27% are neutral.

Zoho Analytics has a marginally higher sentiment score (6.15) for reporting compared with the average score (6.14) for other products in the data visualization category.